|
VIGraph 1.0
|
Quick Description: (Read All)
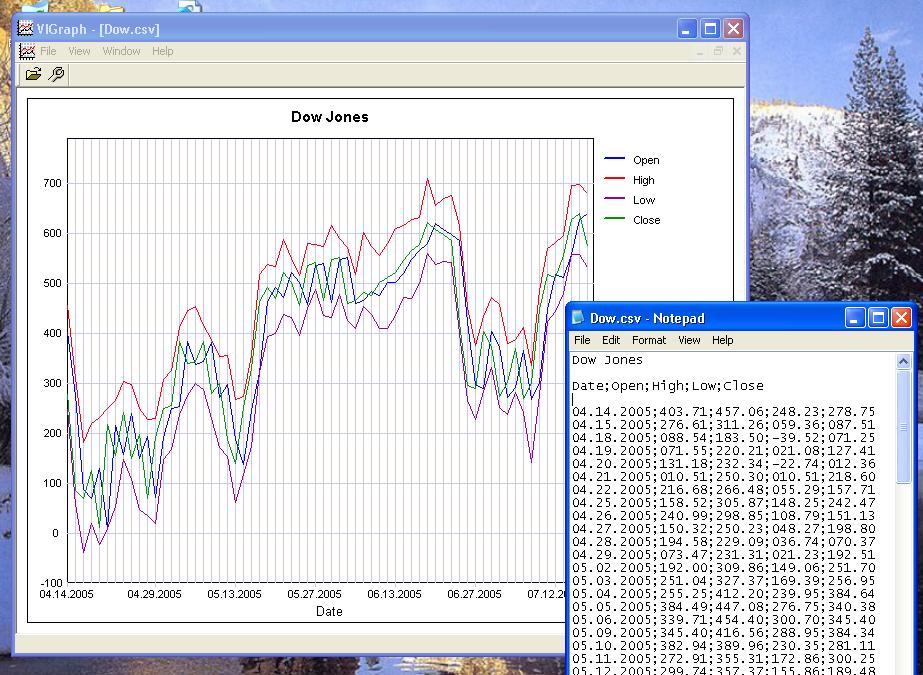
Graph builder for your txt data files
Download
Source: www.rominten.com
File Ping Time (less is better): Could not ping file.
|
|
Category: Business (Rank: 1,611 / 1,823): Investment Tools (Rank: 99 / 114)
Downloads: 0 This Week (Rank: 14,132 / 15,688) / 154 Total (Rank: 14,497 / 15,688)
Developer: Valeri Vlassov
Software Home Page: http://www.rominten.com/VIGraph
License Type: Demo ($24.00)
Language: English
Most Recent File Validation ( ?): Tue, February 5th, 2008 4:23 PM CST
OS: Win98,WinME,Windows2000,WinXP,Windows2003 - Install and Uninstall.
|
Screenshot: (Source: www.rominten.com - Ping: 611 ms - Size: 168 Kb (?)
Keywords:
graph, diagram, graphics
|

| Rank |
Title - Business : Investment Tools |
Downloads |
 |
BREAKTRU STOCKWATCH
($0) - Create a portfolio with this spreadsheet for Excel |
1984 |
| 2 |
Magic Charts
($49) - Tool to easily follow the stock market using Point and Figure charts. |
1984 |
| 3 |
101Quote
($0) - free intraday quotes,portfolio tracking,export to Excel,firewall friendly |
1939 |
| 4 |
Invest64
($19.95) - Invest64: Property, Shares, Options, etc. Languages, Currencies, annual Returns |
1924 |
| 5 |
QuoTracker
($39.95) - Track world-wide stocks & US/Can. mutual funds & personal portfolios |
1910 |
|
|